Markets
How Every Asset Class, Currency, and S&P 500 Sector Performed in 2021
How Every Market Performed in 2021
After the roller coaster of volatility in 2020, the majority of asset classes in 2021 saw positive returns as the world reopened for business.
The Federal Reserve’s accommodative monetary policy, supply chain struggles, and high demand for fuels and raw materials for the clean energy transition largely shaped the markets.
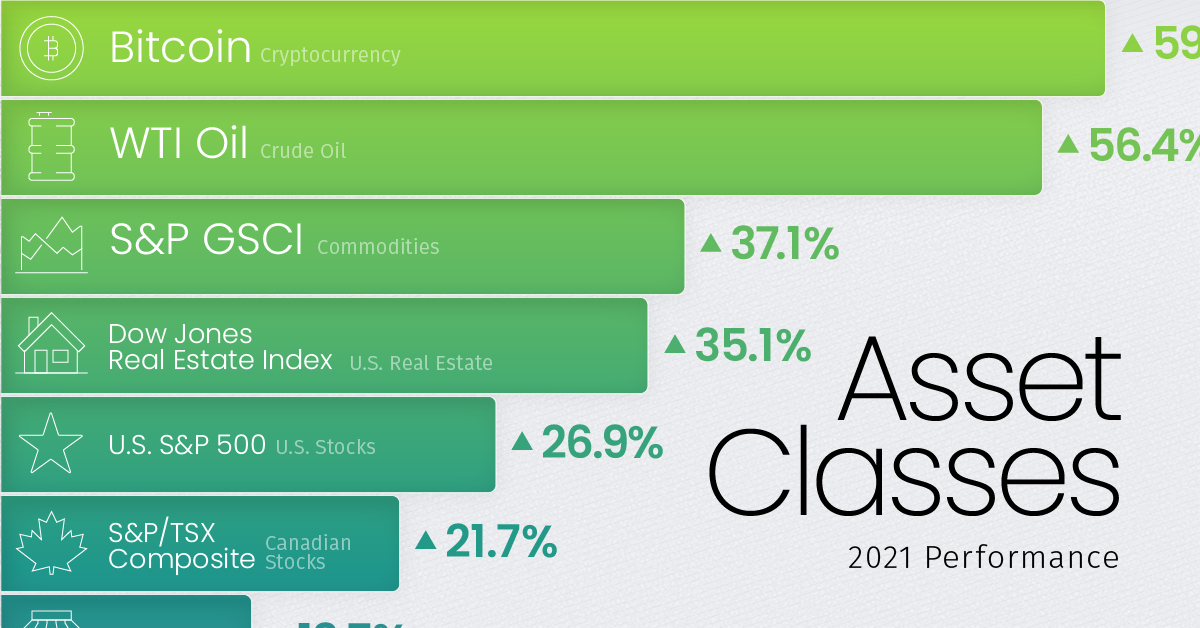
Alongside the rise in inflation, commodities and cryptocurrency outperformed as broad equity indices saw double-digit returns, with the S&P 500 rising by 26.9% in 2021.
Markets Roundup for 2021
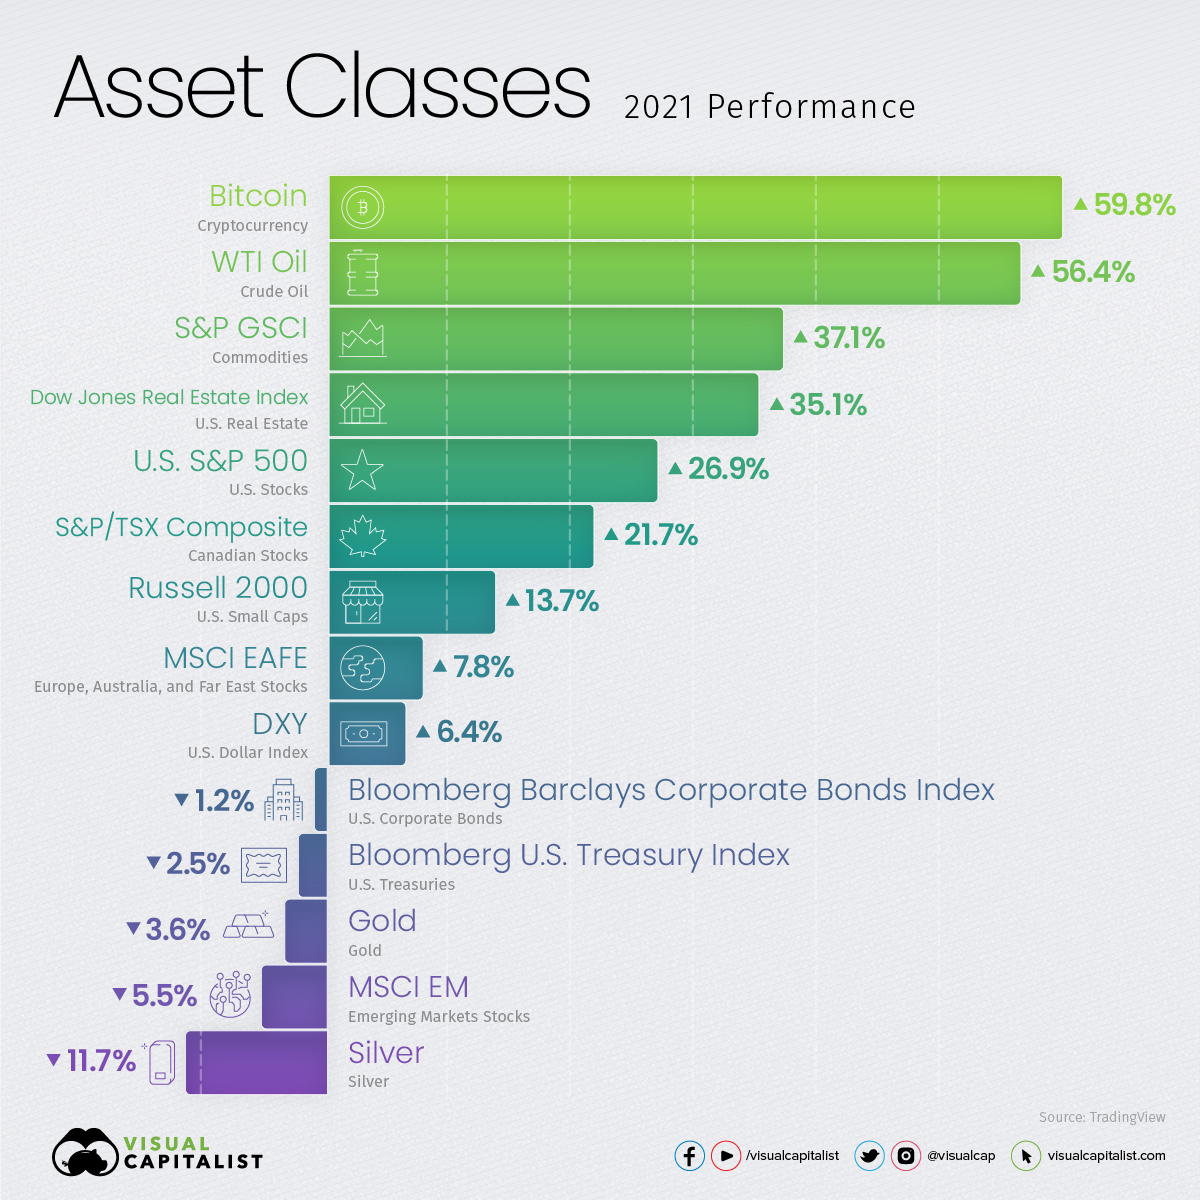
Speculation and the energy fuels for the world’s reopening were two of the main themes for markets in 2021, reflected in Bitcoin (59.8%) and crude oil (56.4%) being the top two performing assets in that time frame.
The S&P GSCI commodity index (37.1%) was another top performer, as agricultural and livestock food prices rose alongside the Dow Jones Real Estate Index (35.1%).
| Asset Class | 2021 Return | Asset Type |
|---|---|---|
| Bitcoin | 59.8% | Cryptocurrency |
| WTI Crude Oil | 56.4% | Commodity |
| S&P GSCI | 37.1% | Commodity |
| Dow Jones Real Estate Index | 35.1% | Real Estate |
| S&P 500 | 26.9% | Equities |
| S&P/TSX Composite | 21.7% | Equities |
| Russell 2000 | 13.7% | Equities |
| MSCI EAFE | 7.8% | Equities |
| U.S. Dollar | 6.4% | Currency |
| Bloomberg Barclays Corporate Bonds Index | -1.2% | Bonds |
| Bloomberg U.S. Treasury Index | -2.5% | Bonds |
| Gold | -3.6% | Commodity |
| MSCI Emerging Markets | -5.5% | Equities |
| Silver | -11.7% | Commodity |
Source: TradingView
Despite most physical and digital commodities seeing price gains, precious metals such as gold (-3.6%) and silver (-11.7%) struggled to hold onto their value, while industrial and battery metals like lithium (477.4%) and cobalt (207.7%) surged.
Large cap equity indices like the S&P 500 (26.9%) almost doubled the returns of small caps (Russell 2000, 13.7%), with emerging markets failing to keep up as they fell 5.5%.
How the S&P 500 Sectors Performed
After last year’s poor performance as the worst-performing S&P 500 sector, energy (47.7%) was 2021’s best performing sector alongside the rise in crude oil and other energy commodities.
Two other negative performers last year, real estate (42.5%) and financials (32.6%), also turned it around and were among the top performing sectors this year.
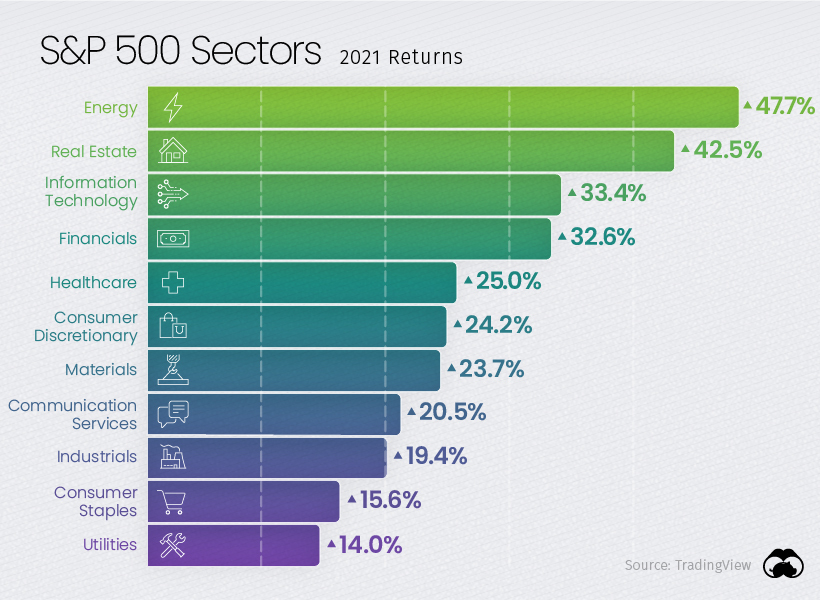
Despite many value equities performing well, growth equities still managed to keep a strong pace. Information technology (33.4%) continued to provide strong returns with Microsoft (51.2%) outperforming many of the other tech giants.
As Amazon (2.38%) and Netflix lagged behind (11.4%), Apple (33.8%) capped off its strong 2021 returns by becoming the first U.S. company to reach a $3T market cap at the start of 2022.
Foreign Exchange and Currency Returns in 2021
While the U.S. dollar struggled last year with most currencies outperforming it, 2021 saw the dollar index rise by 6.4%, outperforming most other currencies.
The Chinese yuan (2.7%) and Canadian dollar (0.7%) were the only major currencies that managed positive returns against the U.S. dollar, while the Australian dollar (-5.7%), Euro (-7.0%), and Japanese Yen (-10.2%) were among the worst performers.
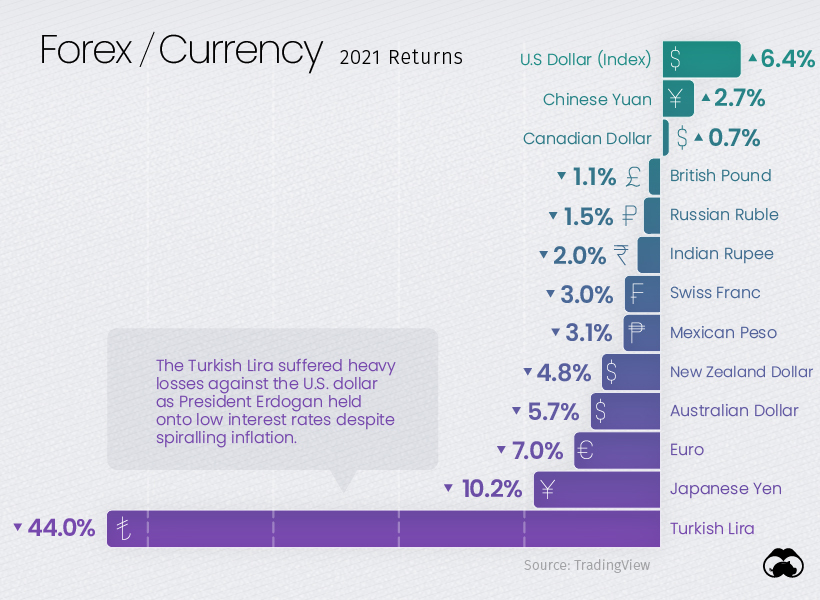
The Turkish lira was the standout loser in foreign exchange, and the turmoil was punctuated by turnover in the country’s finance minister position. While most other emerging economies raised interest rates to fight against inflation, Turkey has continued cutting rates and looks set to default on its $446 million of external debt.
The Winners and Losers of 2021
As the COVID-19 pandemic defined many of the winners and losers in 2020, the gradual reopening of international travel and business shaped the over and underperformers of 2021.
Cryptocurrencies had a standout year beyond Bitcoin (59.8%), which was greatly outpaced by many other cryptocurrencies and smart contract platforms like Ethereum (398.3%), Solana (11,177.8%), Avalanche (3,334.8%), and Luna (12,967.3%).
While Tesla (49.8%) had another strong year, Lucid and Ford Motors greatly outperformed Elon Musk’s company and the rest of the auto industry with their EV efforts. Demand was so great that Ford had to halt reservations for its F-150 Lightning pickup trucks at the end of 2021.
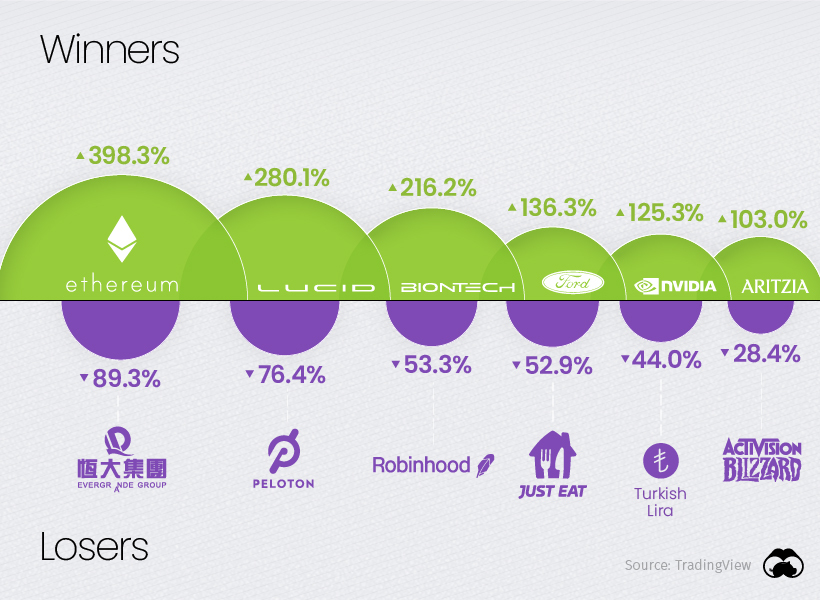
The pain of Evergrande Group (89.3%) shareholders is set to end soon, with the company starting 2022 by halting shares in Hong Kong as its $300 billion in liabilities remain in limbo.
Peloton (-76.4%) was another big loser in 2021 as it gave back nearly all of its gains from last year, proving lockdown speculation fueled most of its former valuation. Just Eat (-52.9%) was similarly hit hard as restaurants reopened in 2021.
Robinhood’s (53.3%) weak performance since its IPO puts a bow on 2021’s retail “stonk” frenzy kicked off by the Wall Street Bets subreddit.
With 2021 being a breakout year for retail traders and investors online, we’ll see if 2022 remains risk-on as the Fed begins tapering, or if markets are due for a change in direction.


Markets
Which Retailers Operate in the Most Countries?
From fast-fashion giant H&M to Apple, we show the top retailers globally with the largest international presence.
The Top Retailers Operating in the Most Countries
This was originally posted on our Voronoi app. Download the app for free on iOS or Android and discover incredible data-driven charts from a variety of trusted sources.
Today, international expansion is a key growth strategy for the world’s top retailers as companies target untapped markets with the highest potential to drive revenue and profit streams.
While traditional retailers have sought out digital strategies as the industry evolves and consumer behaviors change, physical storefronts continue to be a dominant driver of retail sales. In 2023, brick-and-mortar sales comprised 81% of retail sales globally.
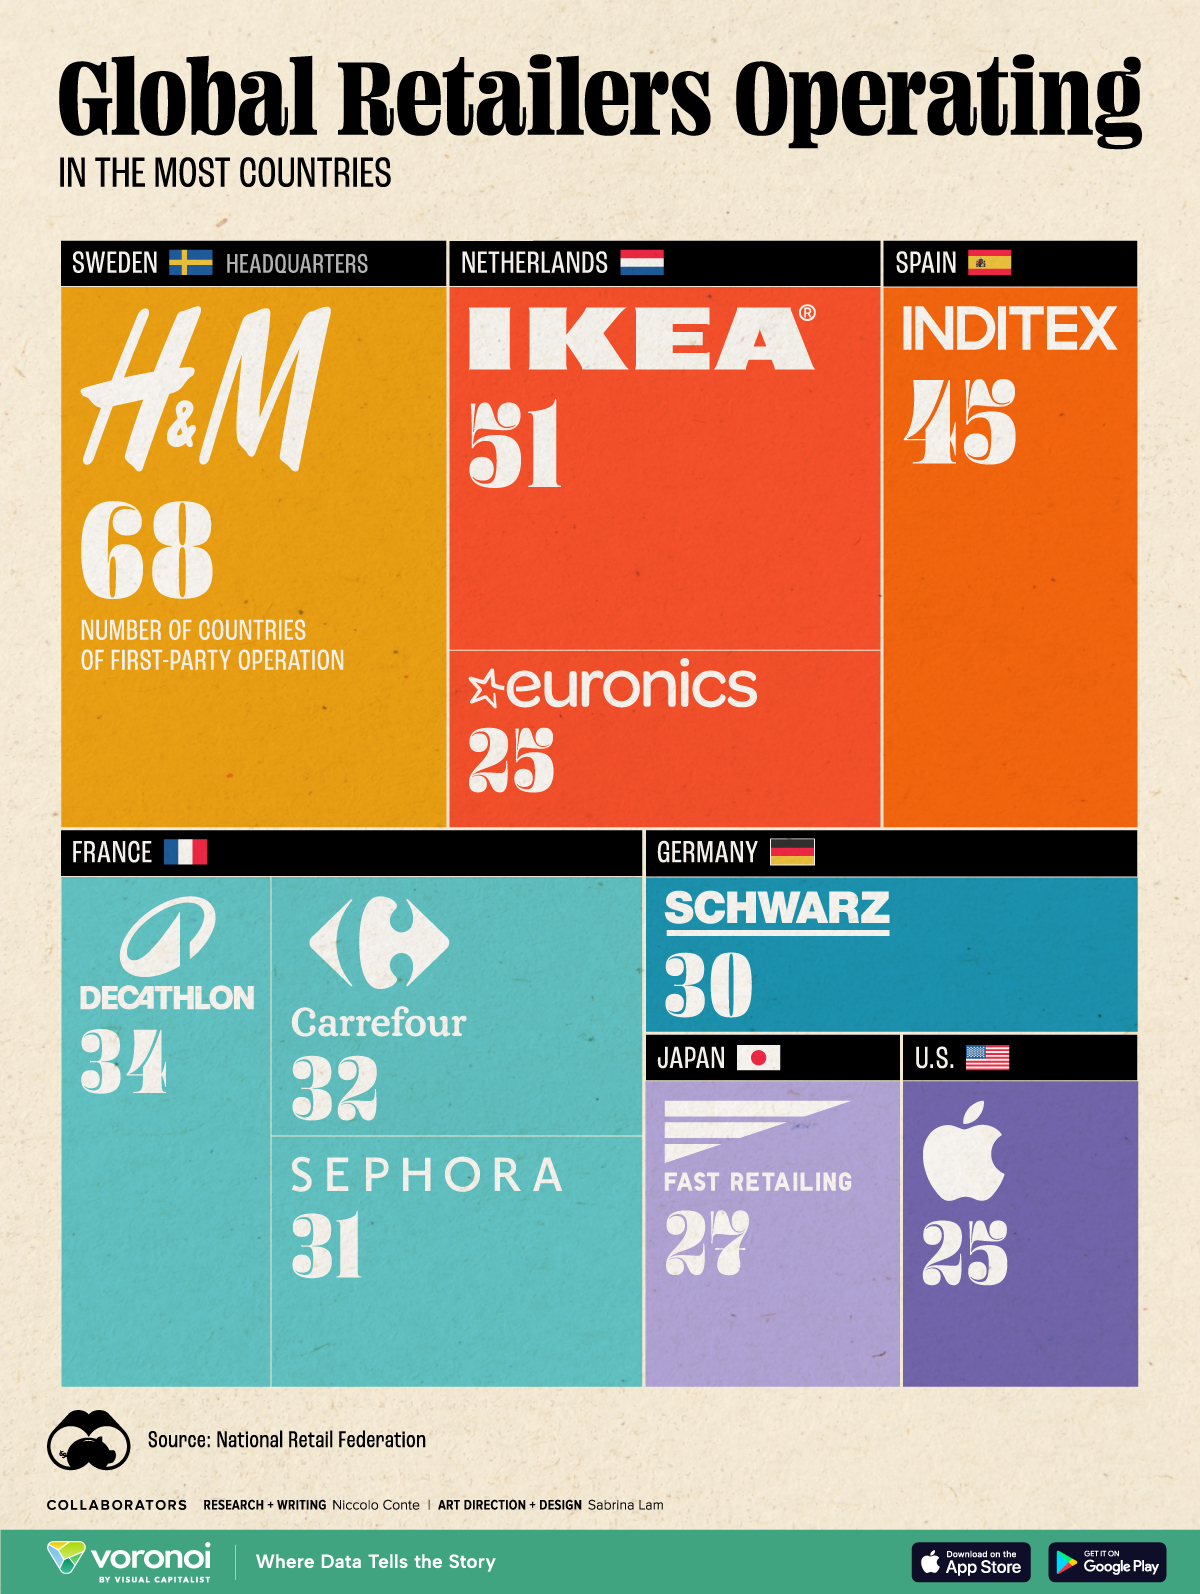
This graphic shows the top retailers operating in the most markets worldwide, based on data from the National Retail Federation.
Global Retailers With the Largest International Footprint
Here are the global retailers with the widest-reaching presence around the world in 2023:
| Ranking | Retailer | Number of Countries of First-Party Operation | Headquarters |
|---|---|---|---|
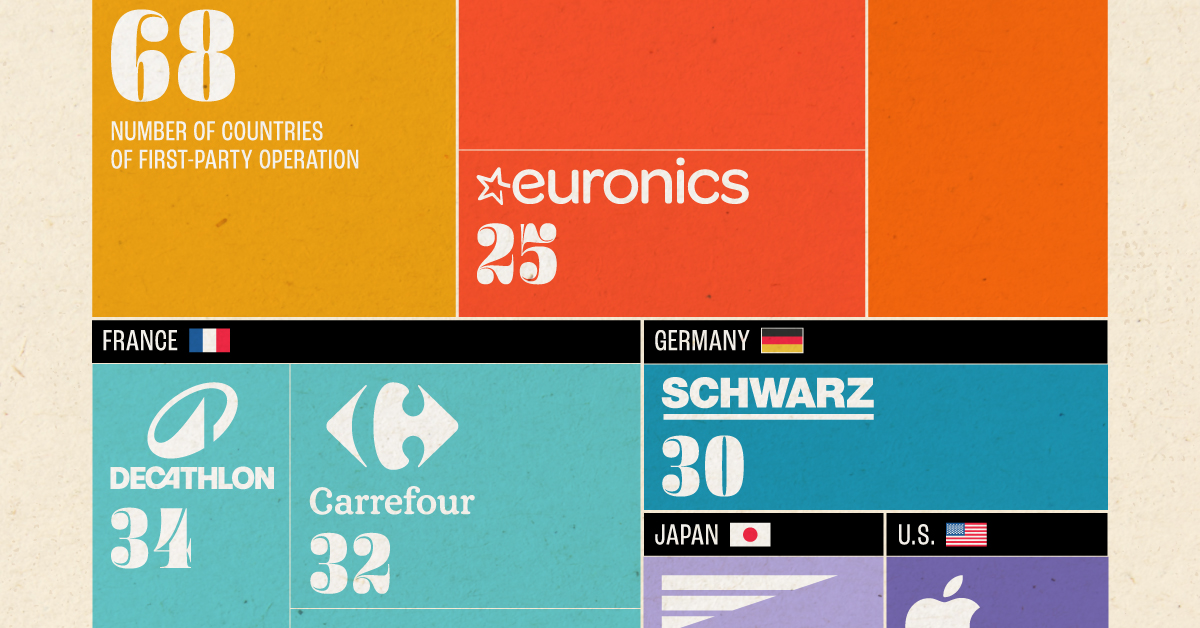
| 1 | H&M | 68 | 🇸🇪 Sweden |
| 2 | IKEA | 51 | 🇳🇱 Netherlands |
| 3 | Inditex | 45 | 🇪🇸 Spain |
| 4 | Decathlon | 34 | 🇫🇷 France |
| 5 | Carrefour | 32 | 🇫🇷 France |
| 6 | Sephora (LVMH) | 31 | 🇫🇷 France |
| 7 | Schwarz Group | 30 | 🇩🇪 Germany |
| 8 | Fast Retailing | 27 | 🇯🇵 Japan |
| 9 | Euronics International | 25 | 🇳🇱 Netherlands |
| 10 | Apple | 25 | 🇺🇸 U.S. |
Notably, eight of the top 10 companies with the widest market reach hail from Europe.
Fast-fashion giant H&M ranks first overall, with 4,454 stores across 68 countries last year. In 2023, the Swedish company earned $21.6 billion in revenues, with its largest markets by number of store locations being the U.S., Germany, and the UK. This year, it plans to open 100 new stores in growth markets, along with shutting down 160 stores in established locations, ultimately decreasing its global store count.
In second is IKEA, with a presence in 51 countries. Last year, the company expanded its footprint in India, launching its first store in the tech hub, Hyderabad. While the company has a broad international reach, its number of storefronts is a fraction of H&M, at 477 total stores worldwide.
Looking beyond the continent, Japan’s Fast Retailing is the top retailer in Asia, operating in 27 countries globally. As the parent company to fashion brand Uniqlo, it also stands as the seventh most valuable listed firm by market capitalization in the country.
Additionally, Apple is the sole American company to make this list, with storefronts in 25 countries. Overall, the company operates four types of retail stores: regular, AppleStore+, flagships, and flagship+. Regular stores often earn $40 million annually, while flagship+ stores typically earn more than $100 million.
By 2027, the company plans to build or remodel 53 stores globally, with the majority located in the U.S. and China.

-

 Healthcare2 weeks ago
Which Countries Have the Highest Infant Mortality Rates?
-

 Misc1 week ago
Visualizing Global Losses from Financial Scams
-

 population1 week ago
Mapped: U.S. States By Number of Cities Over 250,000 Residents
-

 Culture1 week ago
Charted: How the Logos of Select Fashion Brands Have Evolved
-

 United States1 week ago
Mapped: Countries Where Recreational Cannabis is Legal
-

 Misc1 week ago
Visualized: Aircraft Carriers by Country
-

 Culture1 week ago
How Popular Snack Brand Logos Have Changed
-

 Mining2 weeks ago
Visualizing Copper Production by Country in 2023